Not long ago, I shared how to monitor Kubernetes costs using OpenCost, Prometheus, and Grafana. In this follow-up, I want to highlight a specific feature: setting up proactive budget alerts using OpenCost and Prometheus. It's a simple but powerful way to catch cost overruns early.
For the full guide, including setup and dashboards, check out the original post: Kubernetes Cost Tracking Simplified with OpenCost, Prometheus, and Grafana. This post builds on that setup to show how to configure proactive budget alerts using the same tools.
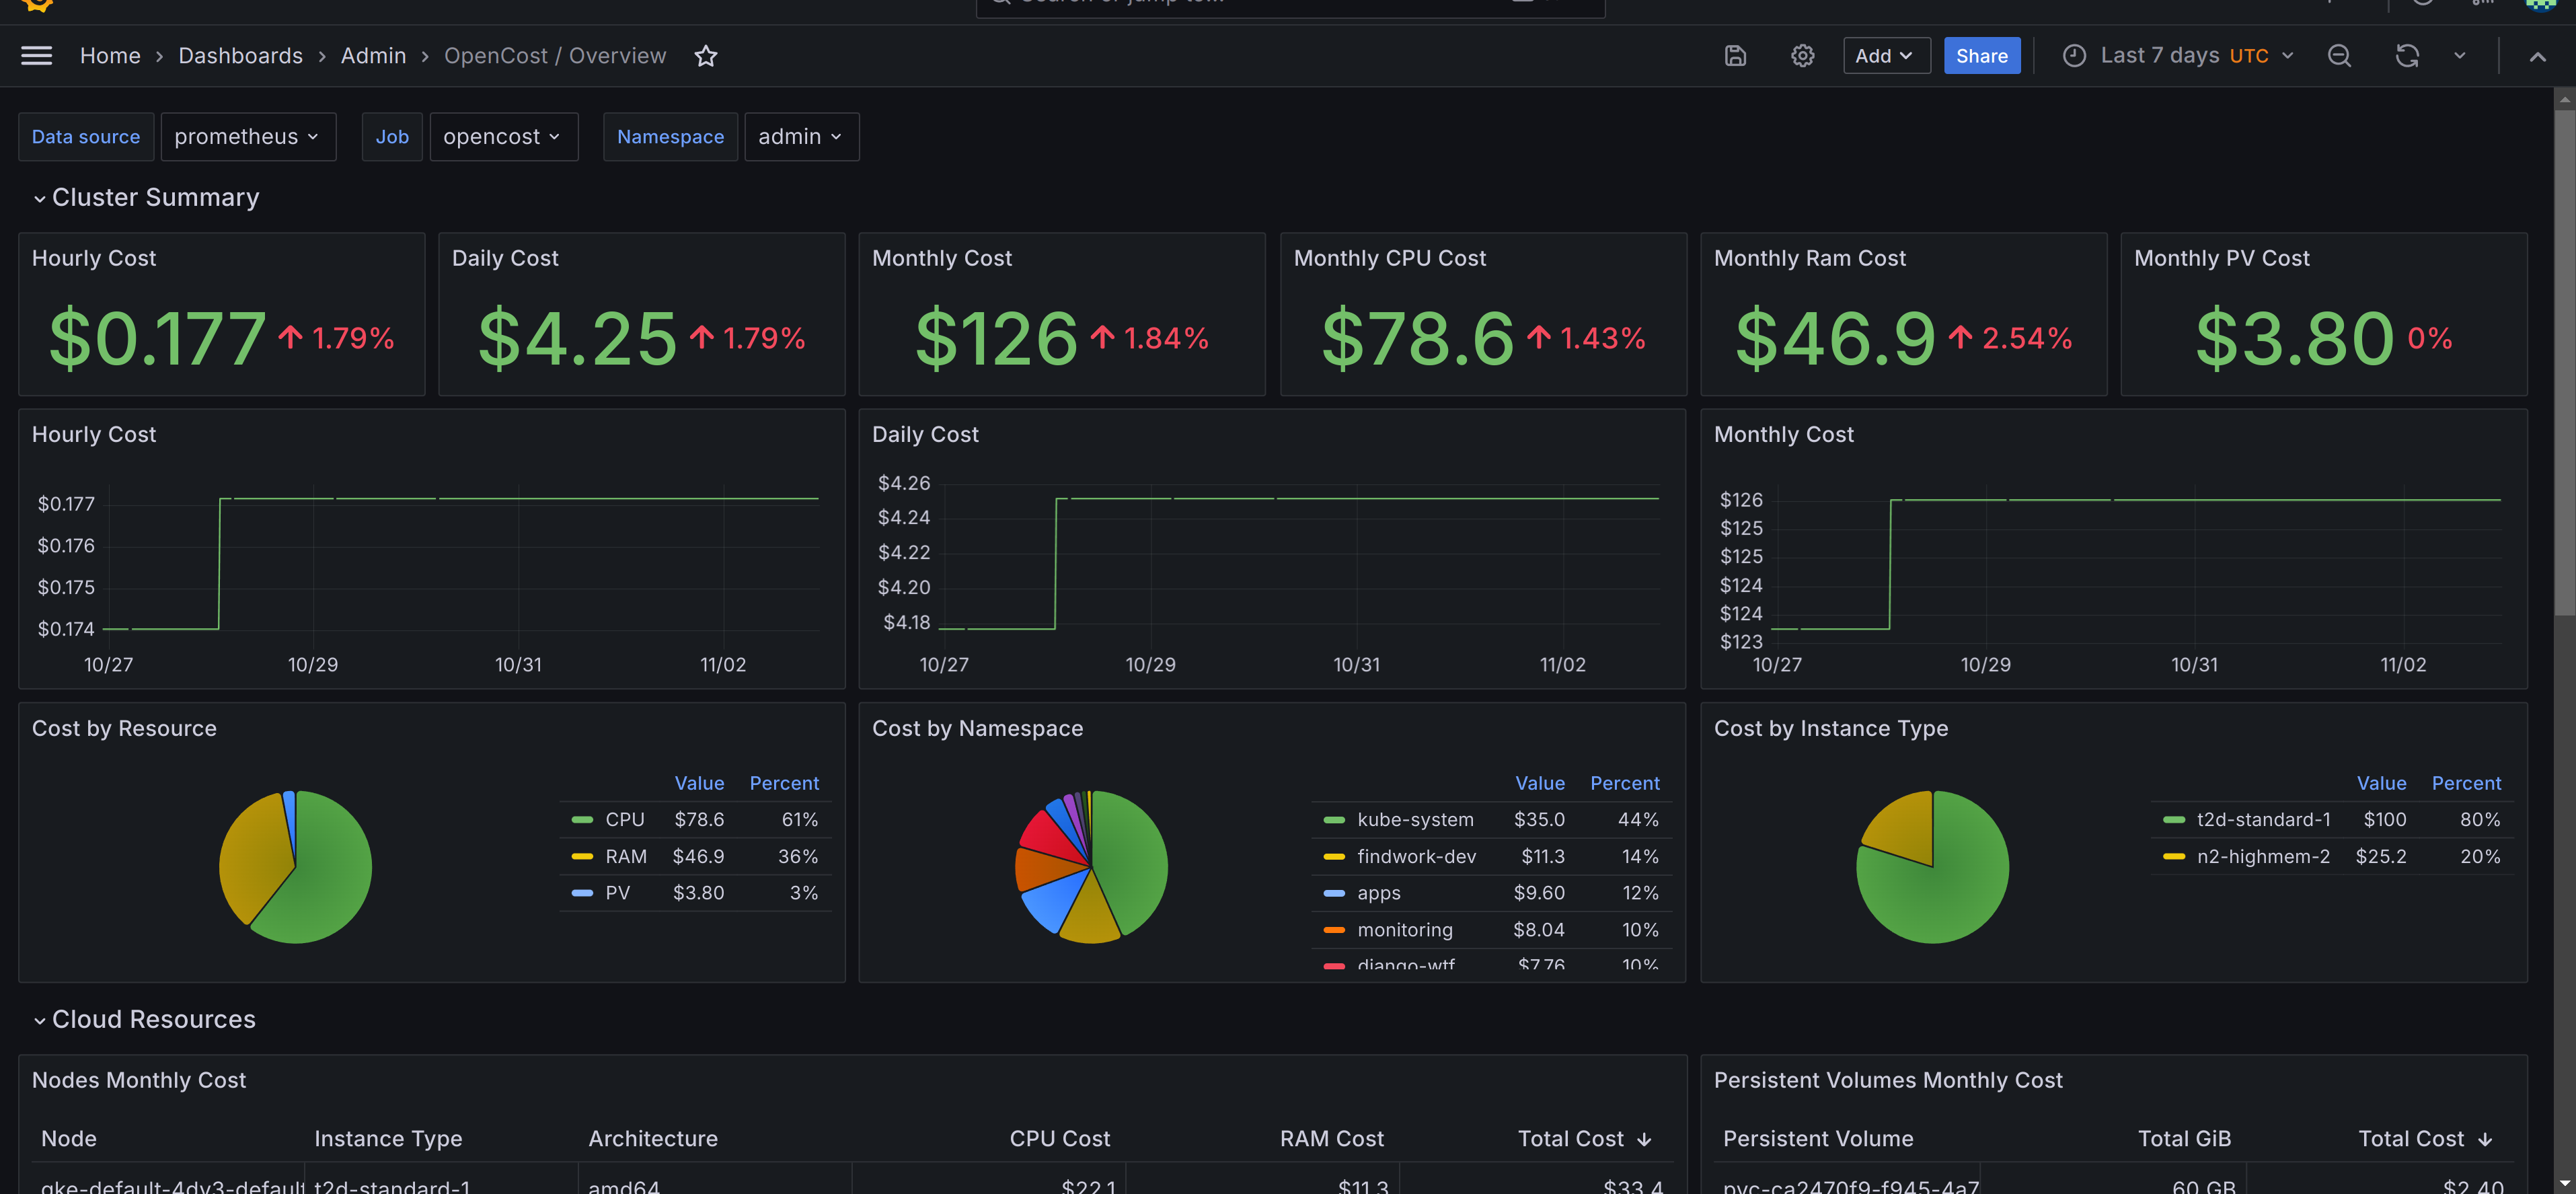
Assuming OpenCost metrics are already flowing into Prometheus, the following sections cover the Prometheus alert rules used to track and respond to cost thresholds.
Alerts
The cost alerts are customizable using the config.libsonnet file provided in the repository for the Prometheus alerts. If you're familiar with Jsonnet, then adjusting, and tailoring these alerts to your specific needs should be straightforward. That said, it’s important to note: these alerts aren't plug-and-play - you must adapt the configuration to reflect your own Kubernetes workloads, budget expectations, and cost tolerances.
You can find the default alert definitions in the prometheus_alerts.yaml file. Below are descriptions and example use cases for the two primary alerts included:
OpenCostMonthlyBudgetExceeded
This alert fires when your predicted monthly cost exceeds a predefined threshold. The system predicts monthly cost by taking the current hourly cost, adding the hourly PersistentVolumeCost, and multiplying the total by 730 hours - a rough estimate for a 30-day month. Example:
expr: |
  (
    sum(
      node_total_hourly_cost{
        job=~"opencost"
      }
    ) by (cluster) * 730
    or vector(0)
    +
    sum(
      sum(
        kube_persistentvolume_capacity_bytes{
          job=~"opencost"
        }
        / 1024 / 1024 / 1024
      - by (cluster, persistentvolume)
      *
      sum(
        pv_hourly_cost{
          job=~"opencost"
        }
      - by (cluster, persistentvolume)
    ) * 730
    or vector(0)
  )
  > 200
Default threshold: $200. Adjust this based on your budget expectations in the config.libsonnet file using the field monthlyCostThreshold.
What it means: if your current usage rate continues, you’re projected to spend more than $200 this month.
Use case: set this alert if you have clusters with predictable costs and want to catch cost creep early.
OpenCostAnomalyDetected
This alert watches for sudden cost spikes. It compares the average hourly cost over the past 3 hours with the average over the last 7 days, and fires if the short-term cost exceeds the long-term average by more than 15%.
Example:
expr: |
  (
    (
      (
        avg_over_time(
          sum(
            node_total_hourly_cost{
              job=~"opencost"
            }
          ) by (cluster) [3h:30m]
        )
        or vector(0)
      )
      +
      (
        avg_over_time(
          sum(
            (
              kube_persistentvolume_capacity_bytes{
                job=~"opencost"
              } / 1024 / 1024 / 1024
            )
            - on (cluster, persistentvolume)
            group_left()
            pv_hourly_cost{
              job=~"opencost"
            }
          ) by (cluster) [3h:30m]
        )
        or vector(0)
      )
    )
    -
    (
      (
        avg_over_time(
          sum(
            node_total_hourly_cost{
              job=~"opencost"
            }
          ) by (cluster) [7d:30m]
        )
        or vector(0)
      )
      +
      (
        avg_over_time(
          sum(
            (
              kube_persistentvolume_capacity_bytes{
                job=~"opencost"
              } / 1024 / 1024 / 1024
            )
            - on (cluster, persistentvolume)
            group_left()
            pv_hourly_cost{
              job=~"opencost"
            }
          ) by (cluster) [7d:30m]
        )
        or vector(0)
      )
    )
  )
  /
  (
    (
      (
        avg_over_time(
          sum(
            node_total_hourly_cost{
              job=~"opencost"
            }
          )  by (cluster) [7d:30m]
        )
        or vector(0)
      )
      +
      (
        avg_over_time(
          sum(
            (
              kube_persistentvolume_capacity_bytes{
                job=~"opencost"
              } / 1024 / 1024 / 1024
            )
            - on (cluster, persistentvolume)
            group_left()
            pv_hourly_cost{
              job=~"opencost"
            }
          )   by (cluster) [7d:30m]
        )
        or vector(0)
      )
    )
  )
  > (15 / 100)
Default threshold: 15%. Adjust this in the config.libsonnet file using the field anomalyThreshold.
What it means: it alerts you when your hourly cost suddenly jumps above normal, possibly due to a misconfigured deployment or an unexpected workload.
Use case: use this to catch runaway workloads or unexpected autoscaler behavior quickly.
Conclusion
Setting up cost alerts with OpenCost and Prometheus is a simple way to stay ahead of unexpected spending. With just a few rules, you can catch cost spikes or budget overruns early and take action before they become a problem.